Over the past two decades, the process of purchasing a new mattress has undergone a remarkable transformation. In the past, the only avenue for acquiring a mattress was through physical stores, but now online platforms offer a viable alternative.
Direct-to-consumer mattress companies have played a significant role in ensuring affordable prices and unparalleled convenience for customers. With just a few clicks, customers can effortlessly place an order, benefit from fast and free shipping, and even return the mattress at no extra cost if it fails to meet their expectations.
So how do online mattress sales compare to the traditional in-store buying experience? In this compilation of statistics from the mattress industry, we aim to find answers to this very question.
Without further delay, let’s delve into a summary of the most intriguing statistics from the mattress industry. Let us commence our exploration.
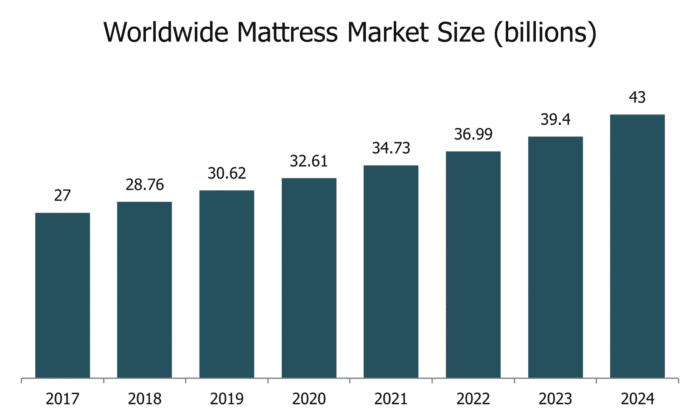
– Worldwide mattress market value: As of 2022, the global mattress market is currently valued at a staggering $37 billion.
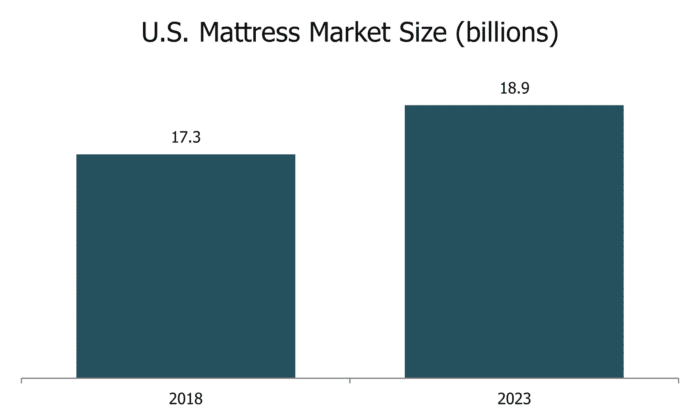
– US mattress market value: The mattress market in the United States is expected to reach a valuation of $18.9 billion by 2023.
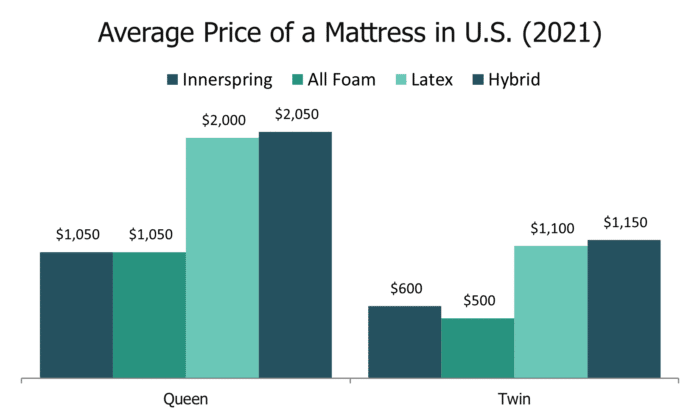
– Average mattress price: On average, innerspring and foam mattresses cost around $1,050, while latex mattresses average around $2,000, and hybrid mattresses around $2,050.
– Most affordable mattress: In terms of affordability, foam mattresses emerge as the most cost-effective option in the market today, with an average price of $500 for Twin size and $1,050 for Queen size.
– US annual mattress sales: The United States witnesses the sale of approximately 16.8 million mattresses each year, projecting into the future until 2023.
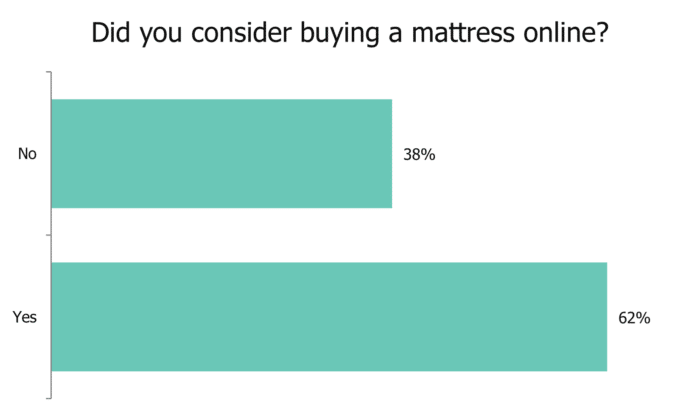
– Online shoppers: According to recent surveys, 62% of consumers have contemplated purchasing a mattress online. Among them, individuals aged between 18 and 35 are the most likely to engage in online mattress shopping, accounting for 71% of this demographic.
– Online vs. In-Store Sales: In 2018, online purchases accounted for 45% of mattress sales, while in-store transactions made up the remaining 55%.
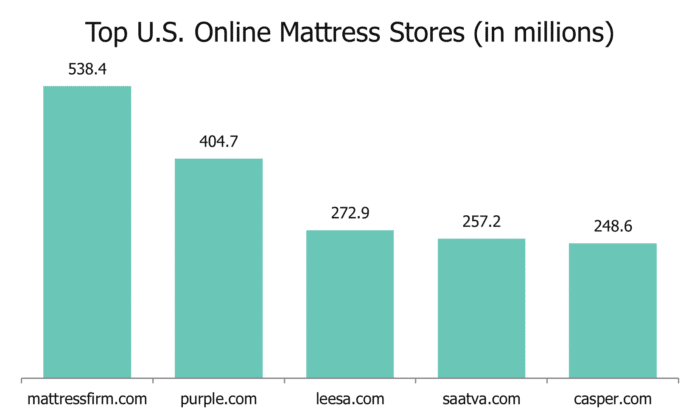
– Top online mattress sales: When it comes to generating revenue, the leading online store is Mattress Firm, amassing an impressive $538.4 million in 2020. It is followed by Purple at $404.7 million and Leesa at $272.9 million.
– Average trial period: Nearly 40% of mattresses offer a minimum trial period of 100 nights, while 20% provide a full-year trial period.
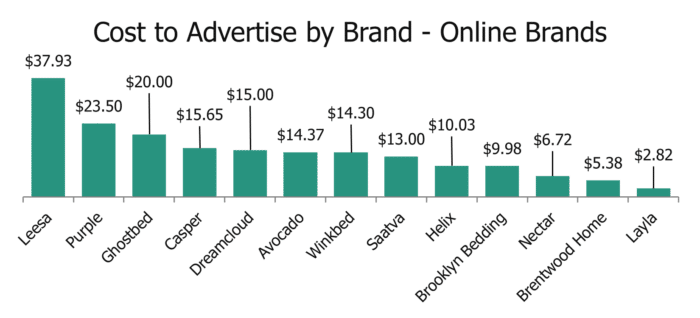
– Costliest Google Ads keywords: The most expensive keywords on Google Ads are “Leesa” at $37.93 per click, “Purple” at $23.50 per click, and “Ghostbed” at $20.00 per click.
With regard to the global market, the mattress industry currently holds a value of $37 billion dollars (2022), and there are estimates that it may grow to reach $43 billion by 2024.
Focusing exclusively on the United States, the mattress market had a value of $17.3 billion in 2018, and it is projected to grow to $18.9 billion by 2023.
Sources: Casper, Forbes, Statista 1, Statista 2.
The price range for new mattresses varies greatly depending on the type of mattress you choose. The most cost-effective option is an all-foam mattress, which typically ranges from $500 to $1,050. Innerspring mattresses are also relatively affordable, with prices ranging from $600 to $1,050. If you’re looking for something a bit more high-end, latex and hybrid mattresses are slightly more expensive. Latex mattresses typically range from $1,100 to $2,000, while hybrids fall in the range of $1,050 to $2,050.
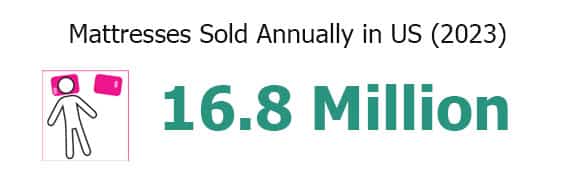
According to the National Sleep Foundation and Statista 1, a staggering 16.8 million new mattresses are sold in the United States each year. These sales contribute to the overall sleep economy, which is estimated to reach $18.9 billion in annual sales by 2023. The average price of a mattress, taking into account various types and sizes, is about $1,122.40.
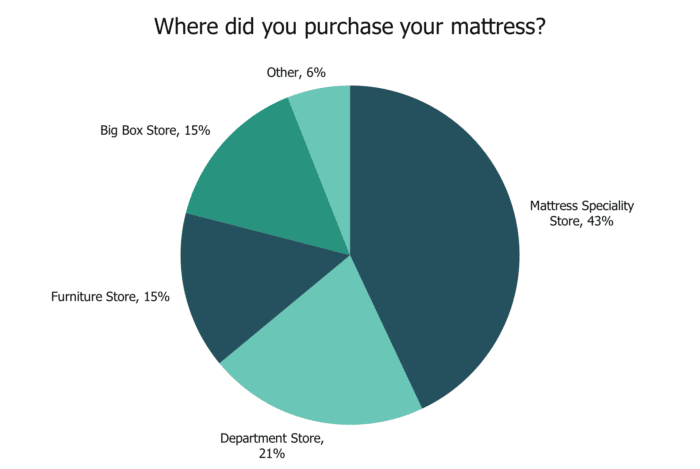
It’s interesting to note that despite the growing popularity of online shopping, only 38% of mattress retailers currently sell their products online. This trend is evident in the purchasing habits of consumers. In 2019, 43% of respondents reported buying their mattresses from specialized mattress stores, while 21% made their purchase at department stores. Additionally, 15% of consumers bought mattresses from furniture stores, and the same percentage opted for big box stores.
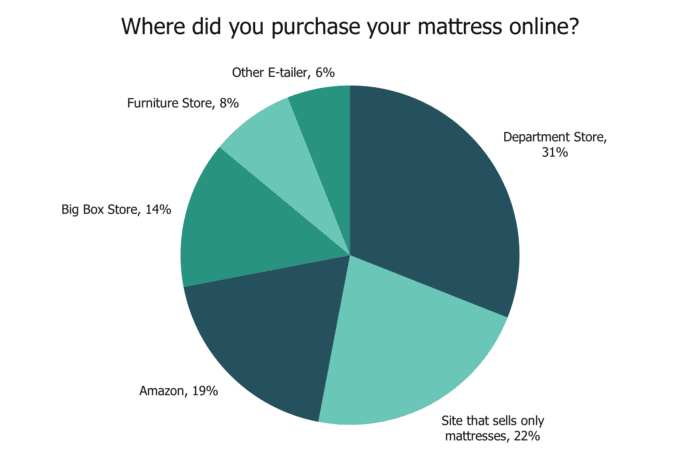
Among those who did choose to buy their mattresses online, 31% made their purchase through online department stores. Another 22% preferred websites solely dedicated to mattress sales, while 19% turned to Amazon for their mattress needs. Surprisingly, only 8% of online mattress sales came from furniture stores.
Please note that the information provided above is based on the sources mentioned, including Statista 1, Statista 2, Statista 3, and the National Sleep Foundation.
References: CertiPUR-US, Statista 1, Statista 2
In 2018, approximately 45% of mattress sales transpired through online platforms.
A comprehensive survey carried out by the International Sleep Products Association in 2018 yielded enlightening statistics regarding the sales of mattresses. According to the findings, 45% of all mattresses sold that year were procured via online platforms. This marked an increase from the previous year, where 35% of mattress sales were conducted through online retailers.
Furthermore, research indicates that the American populace has displayed an inclination towards purchasing mattresses online. A significant 62% of consumers acknowledged their willingness to contemplate the idea of making an online mattress purchase.
Fast-forward to 2021, and it was projected that mobile commerce would experience a growth rate of 12.2%. In comparison, e-commerce was expected to expand by 9.7%, while brick-and-mortar stores were predicted to witness a modest growth of 4.8%.
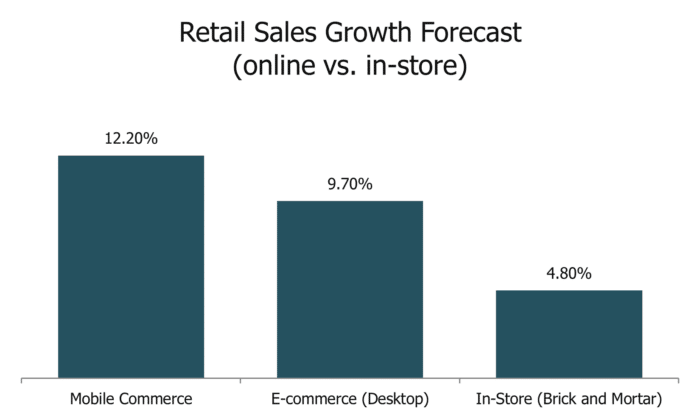
If this ongoing trend persists, there is a plausible scenario where e-commerce will surpass traditional brick-and-mortar transactions in the forthcoming years.
References: CNBC, Statista 1, Statista 2, RIS News
In the time span between 2016 and the present day, the preference among consumers for online purchases has surged impressively from 27% to 47%.
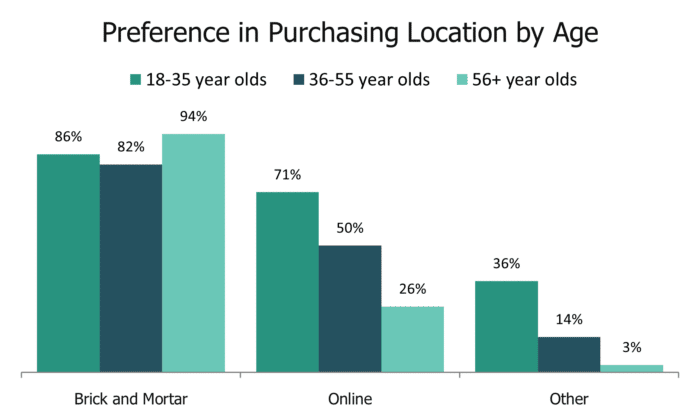
When examining the distribution of this preference across various age demographics, it emerges that the age group of 18-35 exhibits the highest inclination towards online shopping, with approximately 71% of individuals falling in this category. The second-highest percentage corresponds to the age group of 36-55, with 50% of individuals expressing a readiness to buy mattresses online. Predictably, among sleepers aged 56 and above, the inclination to purchase a mattress online is the lowest, with a meager 26% displaying an interest in this method of acquisition.
Source: Research Report on Mattress Consumers / Bed Times Magazine
Among online mattress companies, Mattress Firm secures the highest revenue with a remarkable $538.4 million in sales throughout 2020.
Following Mattress Firm are Purple ($404.7 million), Leesa ($272.9 million), Saatva ($257.2 million), and Casper ($248.6 million), respectively.
References: ecommerceDB.com, Statista 1
While detailed financial information is not often disclosed by private companies, we do possess figures from several notable public companies.
In the subsequent discussion, we will delve into the profits and progress of four major participants in the online mattress market—Tempur Sealy, Sleep Number, Purple, and Casper.
This analysis primarily focuses on market capitalization, although additional factors certainly come into play, including total revenue earned and net sales.
Market capitalization, abbreviated as market cap, accurately gauges a company’s value in the open market, as well as the market’s perception of its future. It reflects the willingness of investors to invest in the company.
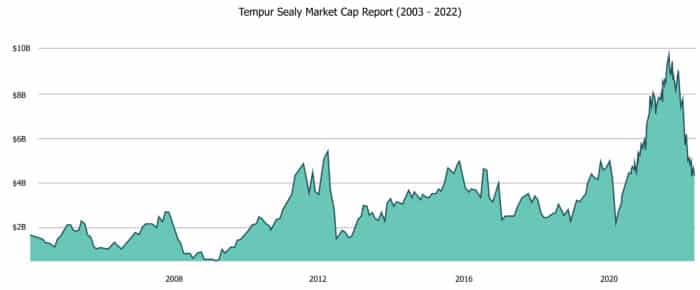
RankCompanyMarket Cap1Tempur Sealy$4.34 billion2Sleep Number$0.91 billion3Purple $0.40 billion4Casper$0.28 billionSource: Companies Market CapTempur Sealy claims the highest market cap among all publicly traded online mattress brands examined, amounting to a notable $4.34 billion. Public records for this company date back to 2003.

In 2017, to counter the loss of nearly $600 million in bedding shipments, the company shifted its focus towards online sales.
With this adjustment, Tempur Sealy capitalizes on the surge of e-commerce during the pandemic and achieves remarkable growth as more shoppers embrace online shopping and provide support to the company.
Sleep Number takes the second spot with a market cap of $0.91 billion. This company offers both online and in-store purchasing options and has witnessed steady growth over the past two decades, albeit enduring turbulent periods in certain economic climates.
Just like Tempur Sealy, we witnessed a tremendous surge in value in the aftermath of the 2020 pandemic as more consumers opted for online mattress purchases. Sleep Number was well-prepared to handle this surge and experienced a significant increase in orders.
Purple Mattress, the newest addition to the four publicly traded companies we examined, was launched in January 2016. Despite entering the market later than its competitors, Purple proved to be a true game-changer. The company dedicated substantial effort and financial resources to digital marketing advertisements.

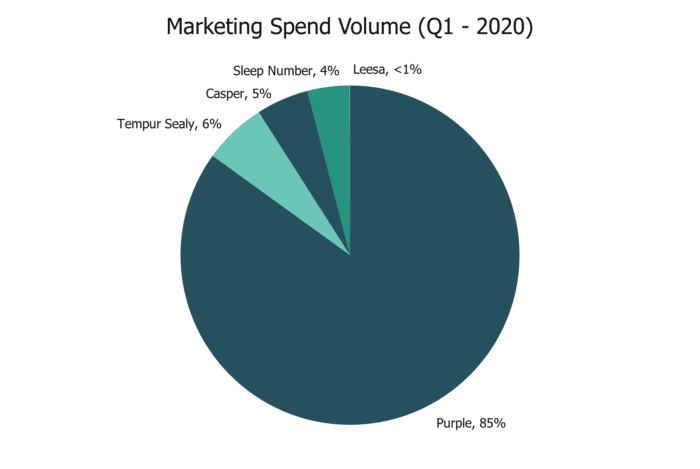
In 2020, Purple allocated a whopping $224.5 million to digital ads. To provide a breakdown of this expenditure for the first quarter of 2021 and compare it with the competition, consider the following information:
Company Digital Ad Spend % of Total Spend
Sleep Number $4.4 million 4%
Purple $102.7 million 85%
Leesa $184,000 > 1%
Casper $6.2 million 5%
Tempur Sealy $7.6 million 6%
* This “total” percentage is based on the analysis of only five brands.
Based on this quarterly evaluation, Purple mattress outshines its competitors by spending over 17 times more on digital advertisements. It seems that this strategy is yielding positive results. In 2020, Purple witnessed a staggering net revenue growth of $648.5 million, representing a remarkable 51.4% increase from the previous year.
However, it is worth noting that Purple may face some challenges ahead. The preceding chart depicts the peak of market capitalization in Q1 2021, followed by a steady decline.
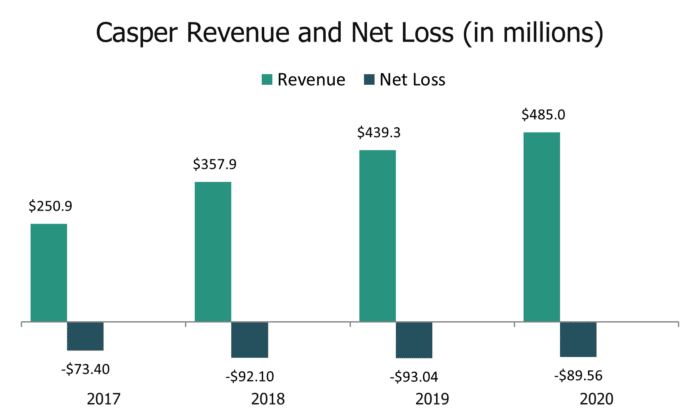
Casper, which was introduced to the market in April 2014, experienced rapid popularity growth. Despite generating substantial revenue, Casper reported significant annual net losses from 2017 to 2020.
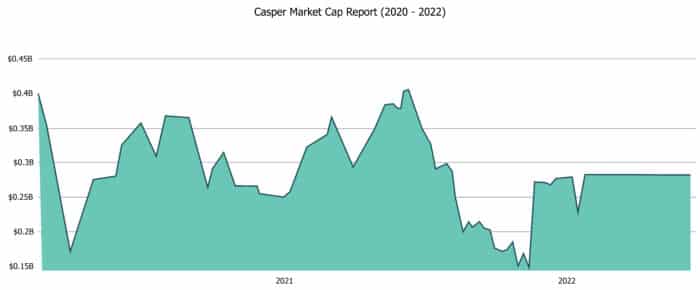
The subsequent market cap chart illustrates the volatility of the stock price over time.
Despite generating significant annual revenue, Casper has been unable to achieve a net profit since its transition to a publicly traded company.
In the year 2020, despite going public, Casper reported a loss of nearly $90 million.
To address this financial situation, Casper shareholders have given their approval for a buyout by Durational Capital Management, a private investment group. The deal values Casper shares at $6.90, resulting in a total valuation of $286 million. This, however, is a mere fraction of the company’s valuation of $1.1 billion back in March 2019.
It is important to note that this information has been derived from various sources including Barron’s, Casper’s official documents, CNBC, Companies Market Cap, and other reputable sources.
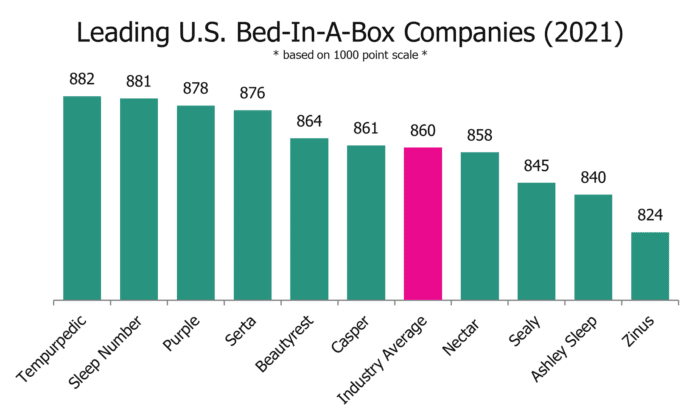
Furthermore, the following six bed-in-a-box mattress companies have managed to exceed the industry’s average customer satisfaction score:
– Tempurpedic
– Sleep Number
– Purple
– Serta
– Beautyrest
– Casper
References:J.D. Power, Statista 1
Within the past year, NapLab has conducted extensive testing on more than 80 of the trendiest mattresses available online. These trials encompassed a total of 83 mattresses.
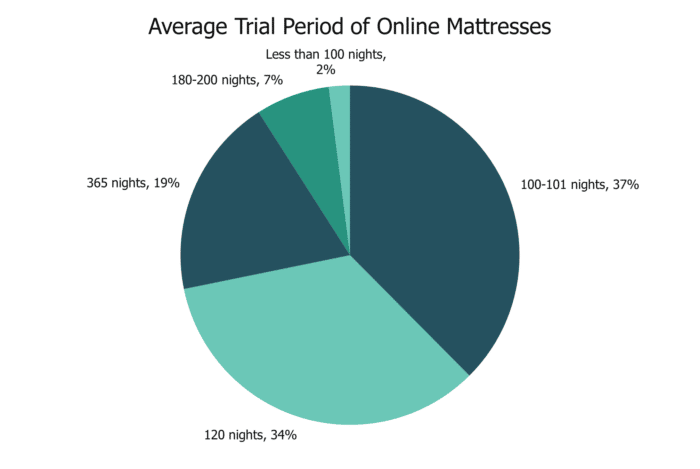
During our evaluation process, we discovered that the majority of these mattresses offer trial periods lasting at least 100 nights. On average, the trial duration was found to be 163 nights.
Here is a breakdown of the trial periods for the 83 mattresses:
- Only 2 out of the 83 mattresses featured trial periods of fewer than 100 nights (2.4%).
- 31 out of the 83 mattresses had trial periods lasting between 100 and 101 nights (37.3%).
- 28 out of the 83 mattresses offered trial periods of 120 nights (33.7%).
- 6 out of the 83 mattresses provided trial periods ranging from 180 to 200 nights (7.2%).
- 16 out of the 83 mattresses boasted trial periods lasting 365 nights (19.2%).
Source: NapLab
In the realm of online commerce, the power of words cannot be underestimated. Words hold significant value, particularly when associated with esteemed brands and specific subjects.
To delve into this matter, we closely examined the cost-per-click (CPC) data for advertising on Google Ads. Our analysis focused on three distinct categories of search terms:
The subsequent charts depict the CPC for the 21 most successful brands, ranked according to their cost per click on Google ads, from highest to lowest.
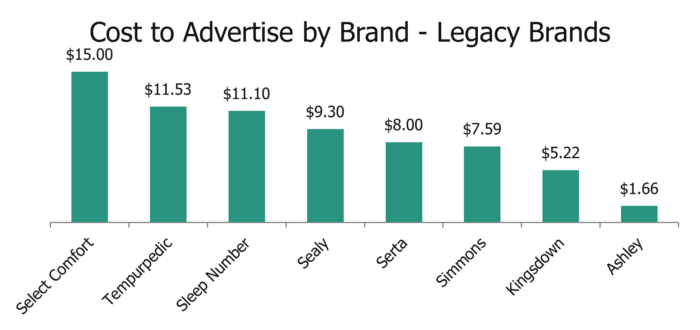
The following chart illustrates the CPC for keywords related to established brands.
This chart illustrates the CPC for keywords related to online brands.
Note: These figures represent the top bid for each keyword, corresponding to the highest range.
The following table provides a comprehensive overview of the cost associated with each search term we investigated. These terms encompass a mixture of brands, mattress-related expressions, and other relevant keywords.
RankKeywordTop bid on first page (low range)Top bid on first page (high range)
1leesa$6.83$37.93
2purple$3.13$23.50
3ghostbed$5.97$20.00
4best mattress$4.90$16.89
5organic mattress$4.36$16.85
6natural mattress$3.92$16.60
7casper$3.74$15.65
8dreamcloud$3.77$15.00
9select comfort$5.67$15.00
10avocado$7.87$14.37
11winkbed$3.37$14.30
12mattress$3.55$14.13
13hybrid mattress$3.61$13.60
14saatva$4.88$13.00
15latex mattress$5.79$12.00
16tempurpedic$2.41$11.53
17sleep number$4.92$11.10
18memory foam mattress$2.80$11.08
19helix$1.77$10.03
20brooklyn bedding$3.00$9.98
21sealy$1.53$9.30
22coil mattress$2.25$8.84
23serta$2.81$8.00
24simmons$0.93$7.59
25nectar$3.87$6.72
26spring mattress$1.92$6.62
27innerspring mattress$1.75$6.60
28brentwood home$2.55$5.38
29kingsdown$1.06$5.22
30layla$0.40$2.82
31ashley furniture$0.39$1.66
Source: Google
As can be observed from the data provided, the top brands in terms of cost for brand searches are Leesa, Purple, and Ghostbed, surpassing all established brands.
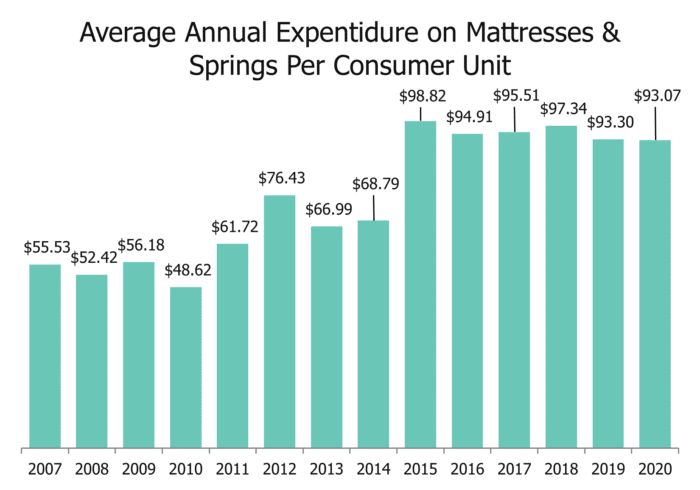
The concept of average annual expenditure refers to the average amount that consumers spend on a particular product each year. In the case of mattresses, it is important to note that most consumers do not purchase a new mattress every year.
On average, a mattress has a lifespan of approximately 7 years, although some may last shorter periods while others may endure longer.
Since mattress purchases are not made annually, the average expenditure is lower compared to the cost of a new mattress. This is due to the fact that the cost is divided among the potential consumers in the United States.
Examining the chart above reveals that the amount of money spent by consumers on mattresses has nearly doubled in the past 15 years. Notably, there was a 30% increase between 2014 and 2015 alone.
Sources: Statista 1
With that, we conclude today’s discussion. The mattress industry has undergone significant transformations in the past decade and will undoubtedly experience more changes in the future.
Businesses that are able to adapt and evolve are the ones that emerge successful. However, the first step is to understand what modern sleepers seek in a mattress.
We are curious to hear your thoughts on the next major shift in the mattress industry. Which statistics surprised you the most? Feel free to reach out to us and continue this conversation!